BTG/USD Upsides Remain Capped
Bitcoin gold price struggled to break the $240 resistance and moved down against the US Dollar.
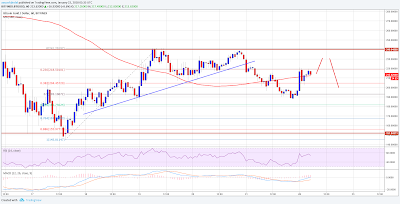
There was a break below a short-term bullish trend line with support at $225 on the hourly chart of BTG/USD (data feed from Bitfinex).
The pair tested the $190-200 support and is currently moving back towards $230-240.
Bitcoin gold price is mostly trading in a range below $240 against the US Dollar. BTG/USD needs to break the $240 resistance to gain traction toward $280 and $300.
There were a few upside swing moves in above $200 in bitcoin gold price against the US Dollar. The price tested the $240 resistance and failed to gain momentum. There were two attempts to trade past $240, but buyers failed to push the price above $240-250. As a result, there was a downside reaction below $230. It broke the 23.6% Fib retracement level of the last wave from the $145.01 low to $241.20 high.
More importantly, there was a break below a short-term bullish trend line with support at $225 on the hourly chart of BTG/USD. The pair even broke the $200 support once and the 100 hourly simple moving average. However, the $190 support prevented declines along with the 50% Fib retracement level of the last wave from the $145.01 low to $241.20 high. BCH is currently moving higher and is trading above the $200 level and the 100 hourly SMA.
It could continue to move higher toward the $230 and $240 resistance levels. However, it needs to gain momentum above $240 to drift towards the $280 and $300 levels. On the downside, the $200 level is a short-term support followed by the $190 low.


0 Comments